


 216-217 / 568

Allergy Prediction App
Motivation- The Problem
Allergic rhinitis (AR) is an inflammatory disease of the nasal mucosa, induced by
an immunoglobulin E (IgE)-mediated reaction in allergen-sensitized subjects. AR
is characterized by sneezing, rhinorrhea, nasal congestion and nasal pruritus.
Worldwide, allergic rhinitis affects between 10% to 30 % of the population,
reduces quality of life and has a significant impact on society and economics.
The Solution
Meteorological factors have been shown to affect the physiology, distribution and
amounts of inhaled allergens and therefore affect the incidence of allergic rhinitis
in patients.
Developing an app that will predict the probability of the symptoms appearance
will help AR patients manage their disease. These features will allow the user to
become more familiar with his disease and prepare better for an upcoming
symptoms.
The Method
Developing an algorithm that combines prediction models built by researchers
based on weather parameters and individual user feedback that allows us to
improve the prediction accuracy and to account for the individual nature of this
disease
Shay Sharvit , Shani Marco
Advisor: Dr. Nir Andelman
Medical Engineering
An application that allows the user to view the
allergy symptoms appearance prediction for the next
few days. The app combines prediction models built
by researchers based on weather parameters and
individual user feedback that improve the prediction
accuracy
Data Collection
We gets the weather data from an external API. For this project we decided to
use data from OpenWeatherMap.com.
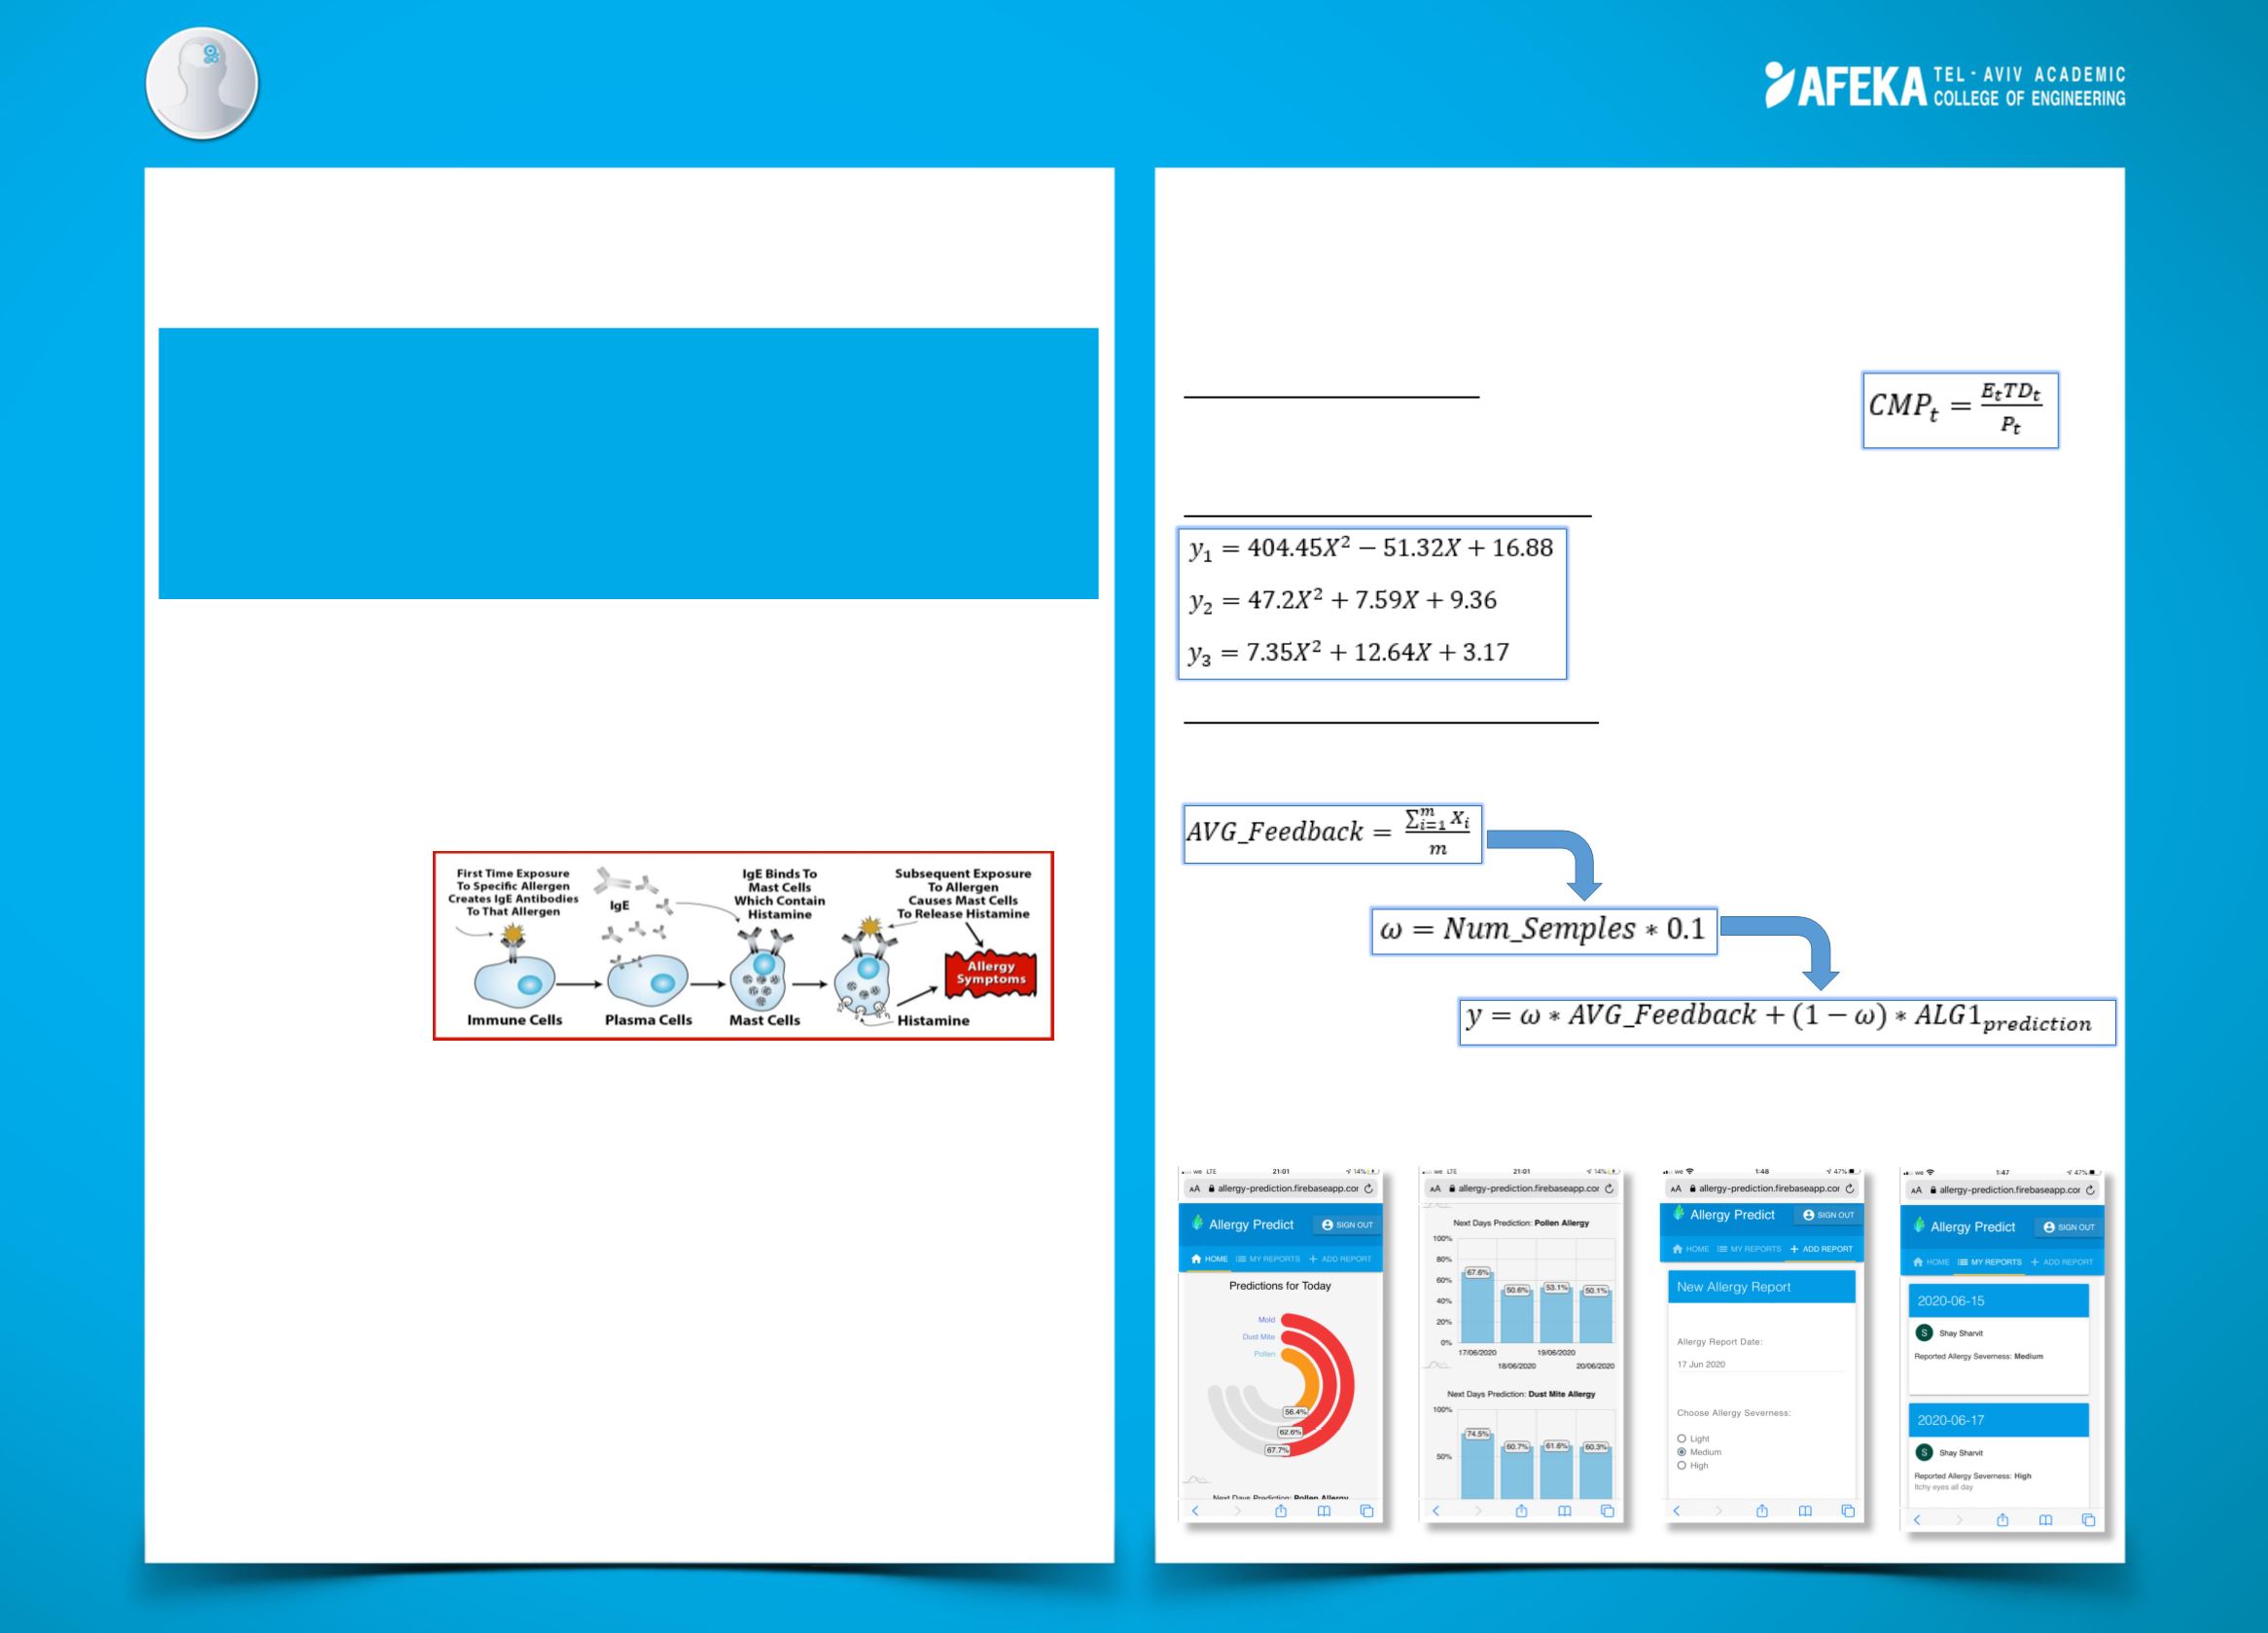
The Algorithm
Step 1 - CMP Calculation:
based on weather data such as
vapor pressure, average minimum temperature and average
sea-level pressure.
Step 2 - Algorithm No.1 Calculation:
base on Ouyang research in Beijing
where y1, y2 and y3 represent the predicted
values for AR incidence in pollen, dust mite
and mold respectively and ‘X’ represents CMP
value.
Step 3 - Algorithm No.2 Calculation:
calculating a weight function based on the
number of feedbacks previously given, then calculating the final probability taking
into account the average feedbacks, their weights and algorithm no.1 results
Results
Using responsive app developing concepts we were able to develop a web-
based app that functions and looks great both on mobile phone and desktops.