


 200-201 / 568

Mean
Amplitude
Sigma
Vascular pathologies classification of images
of Doppler signals generated using
ultrasound simulator
Samantha Natanzon , Tal Markovitz
Advisor: Dr. Sara Naftali
Medical Engineering
Figure 2: UC models and the
acquisition location cases
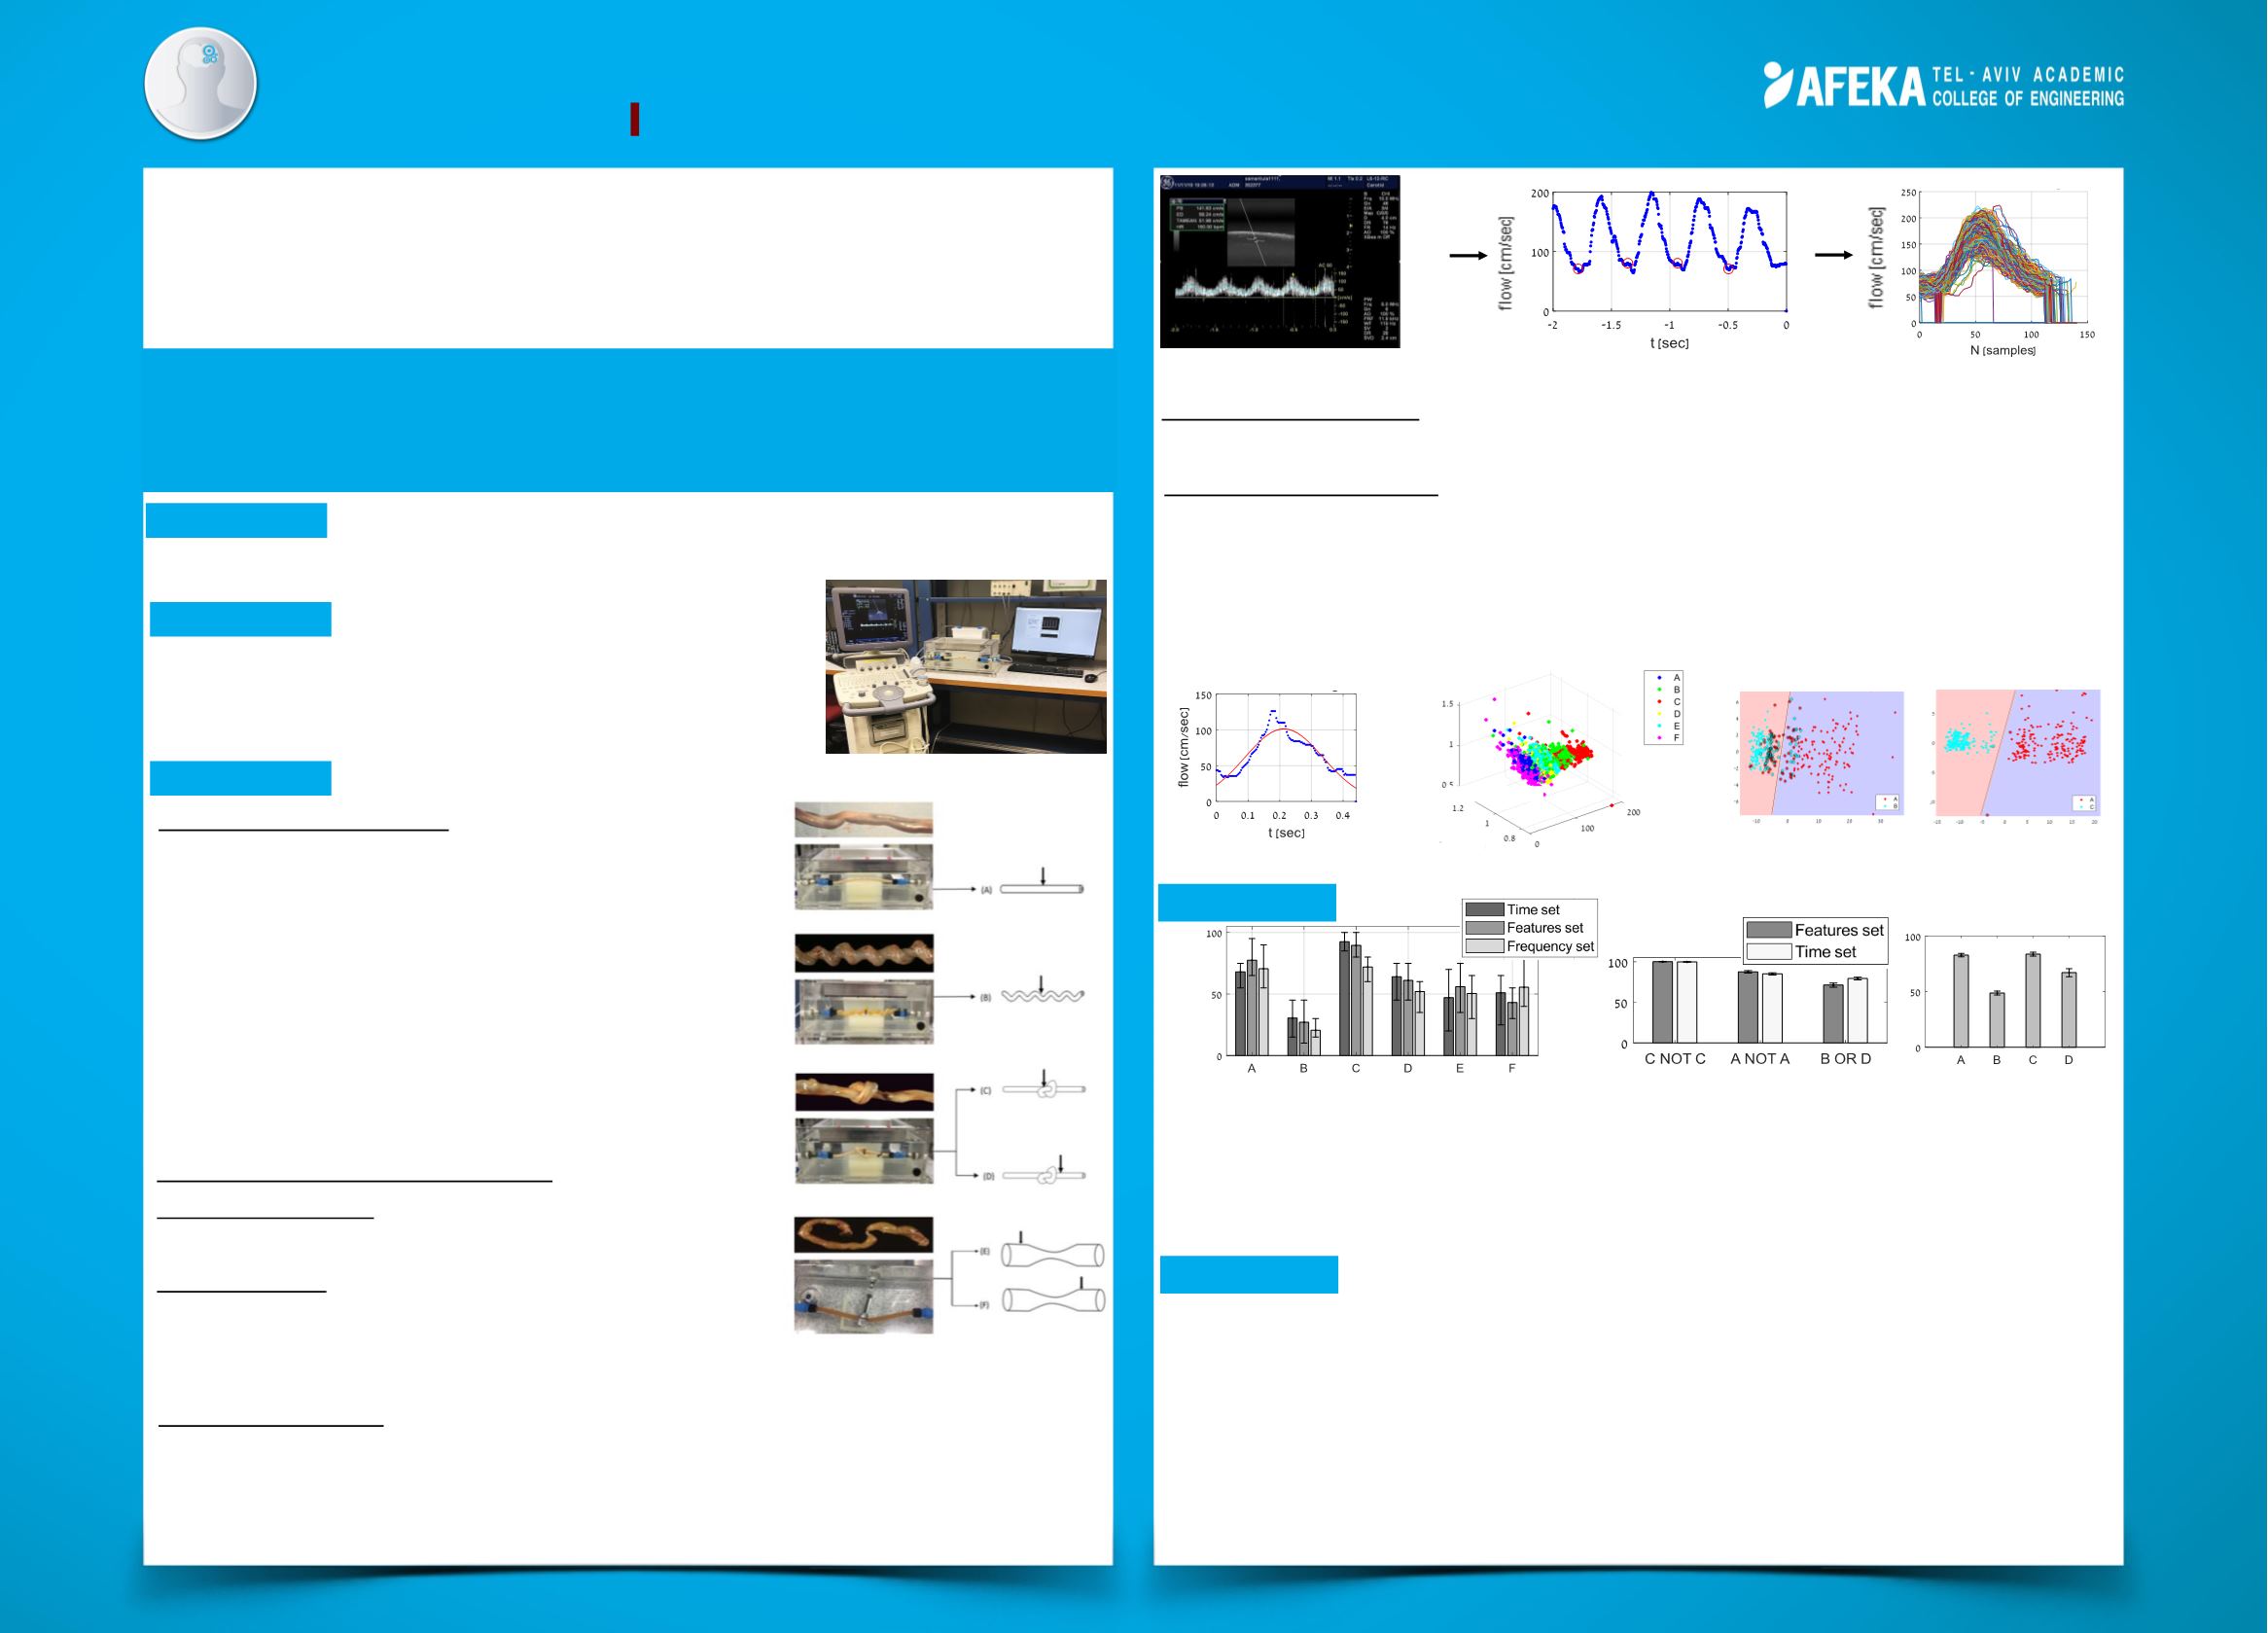
4. Results
5. Conclusions
The project aimed to identify umbilical cord (UC)
pathologies using Doppler signals of simulated blood
flow by applying machine learning methods.
Figure 1: Dynamic simulator for US
3.2. Data Acquisition and Analysis
Image Processing:
was applied to extract the flow
signals from the DUS images from DUS snapshots (Fig. 3).
Segmentation:
The flow signals were segmented
into full cycles of 120 elements per segment. A set of 200
segments was obtained for each case (Fig. 3).
Figure 3: Preprocessing: DUS images (left), extracted flow signal (center), all segments (right)
Dimension Reduction
: Principal Components Analysis (PCA), a linear method, was
used to reduce the dimensions from 120, 60 and 12 to 5 for each feature set, respectively.
Classification Methods:
Classifications for all 3 sets were obtained, using Logistic
Regression (LR), K-Nearest Neighbors (KNN) and linear Support Vector Machine
(SVM) (Fig. 6) methods. For time and features sets also obtained Combinations of
SVM and decision tree classifications. Each Classification was done between pairs of
two UC modes and between 4-10 UC models. All classification models were 10-fold
cross-validated. For each iteration, the training and the test sets were composed of
90% and 10% of the data, respectively.
Figure 4: Fitting Gaussian
Feature Extraction
: Three features sets were tested, the raw signal, its calculated
frequency spectrum, and a set of 12 features that were extracted from each segment:
3 coefficients of the fitted Gaussian model (mean, sigma and amplitude) (Figs. 4-5),
average, energy, Root Mean Square, most common, maximum (max) and minimum
(min), max/min, (max-min)/mean and (max-min)/max values.
Classification
rate [%]
• High classification rates obtained when classifying a signal from case ‘C’ - inside a
knot, to the other cases, in all classification methods.
• It is recommended to obtain at least 250 segments in order to reach high classification
rates for multi classifiers.
• KNN classifier, which is the simplest classifier that was used, yielded similar results as
obtained by the logistic regression, SVM and decision tree classifiers, and the
classifier combinations of SVM yielded highest classification rate for case C.
Figure 7: Classification rates for multi KNN-7 (left), combination of (middle) and Decision tree for the discrete features set (right)
Figure 5: Gaussian features mapping
Classifications accuracy rates obtained:
• Multi KNN- average: A- 71.5% , B – 25% , C- 84% , D-57%, E- 51%, F- 50%.
• Combinations of SVM-average: C NOT C-100% , A NOT A -86.3% , B OR D - 75.4%.
• Decision tree: A – 79.4% , B – 49.1%, C- 81.9%, D -69.6%.
A skilled evaluation of the Doppler Ultrasound (DUS) in terms of blood flow field is a
necessity in order to identify life risking pathologies
.
1. Introduction
2. Objective
To identify UC pathologies using machine learning
methods based on flow signals from UC models obtained
from Doppler ultrasound (DUS) images utilized by dynamic
simulator for ultrasound (US).
3.1. Experiment Set up:
Flow signals obtained within a
dynamic simulator (Fig. 1), a system capable of producing
a controlled pulsatile flow into different vessel models, to
classify between six cases of UC models (Fig. 2): (A)
Straight, (B) Coiled, (C) Inside a true knot, (D) At the exit
of the knot, (E) Before a stenosis, (F) After the stenosis.
The system, includes graphical user interface (GUI)
controller, pulsatile flow pump which produces a circular
flow in a tube that contains flow sensor, vessel model
placed inside a water tank (mimicking the uterus) covered
with an elastic membrane.
3. Methods
1
st
component
1
st
component
2
nd
component
A-B
A-C
Figure 6: The decision boundary of binary SVM